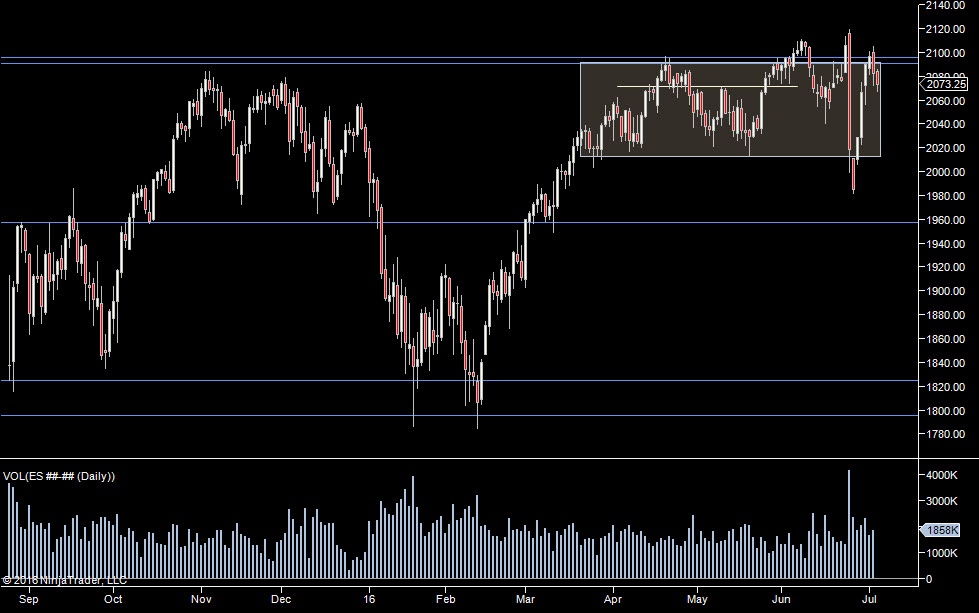
S&P Futures Plan & what to look for at the top of this range over the coming days from Jigsaw Trading.
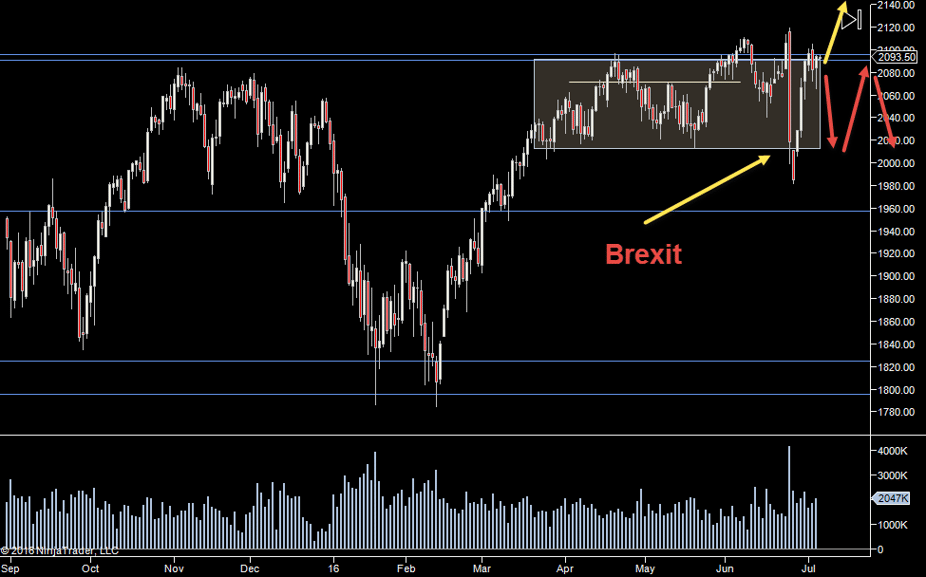
As we can see we’ve been in this range on the S&P Futures since March. There’s been no real fundamental reason for us to break out, so each time we hit the top, we roll back down. We can see that the post-Brexit move did little more than test the range the S&P Futures have been in since March. I’d normally have a strong short bias to the low of the range at this point but I do feel we have a chance of a move to 2200 because of the way the market shrugged off the Brexit news. The market didn’t know how the vote would go, now it does and so maybe that’s enough uncertainty off the table to allow the S&P Futures to rise once more.
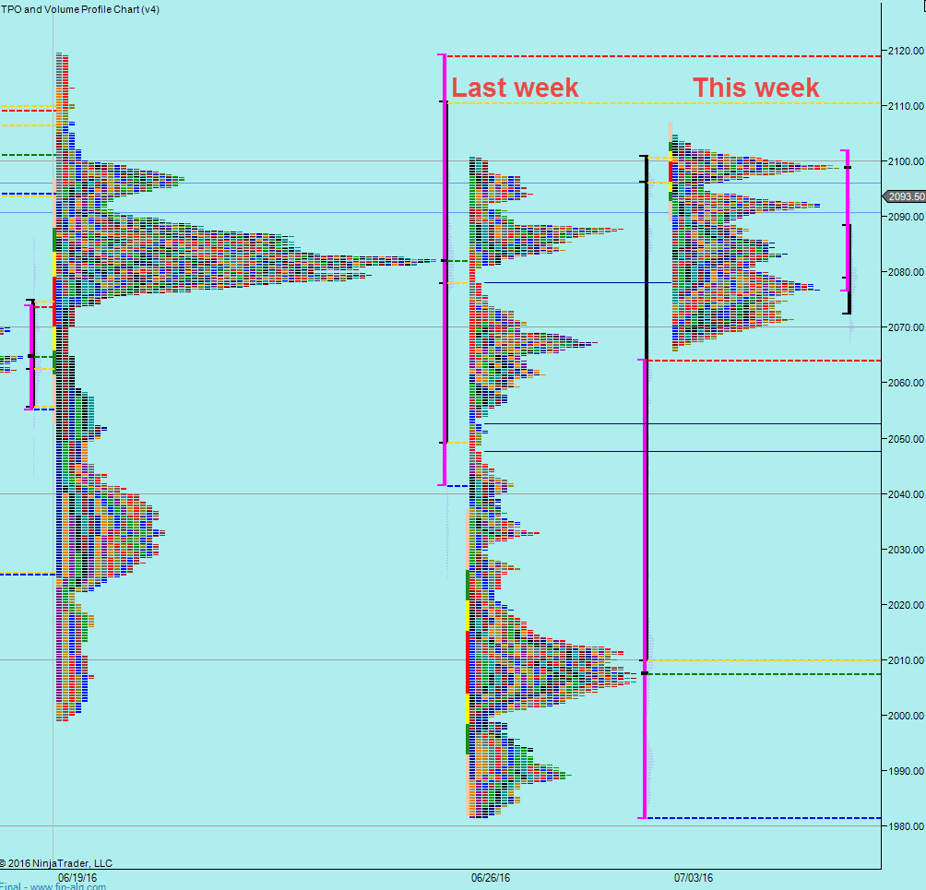
Here we have the Weekly Market Profiles (TPO Charts) for the S&P Futures. We can see that the trading is very uniform this week which lends itself to fading the extremes. We have a decent range, so I will not be fading based on the price hitting the extremes but rather let other traders do the heavy lifting and then jump on board once the extreme has been “shaken out” and direction is clear.
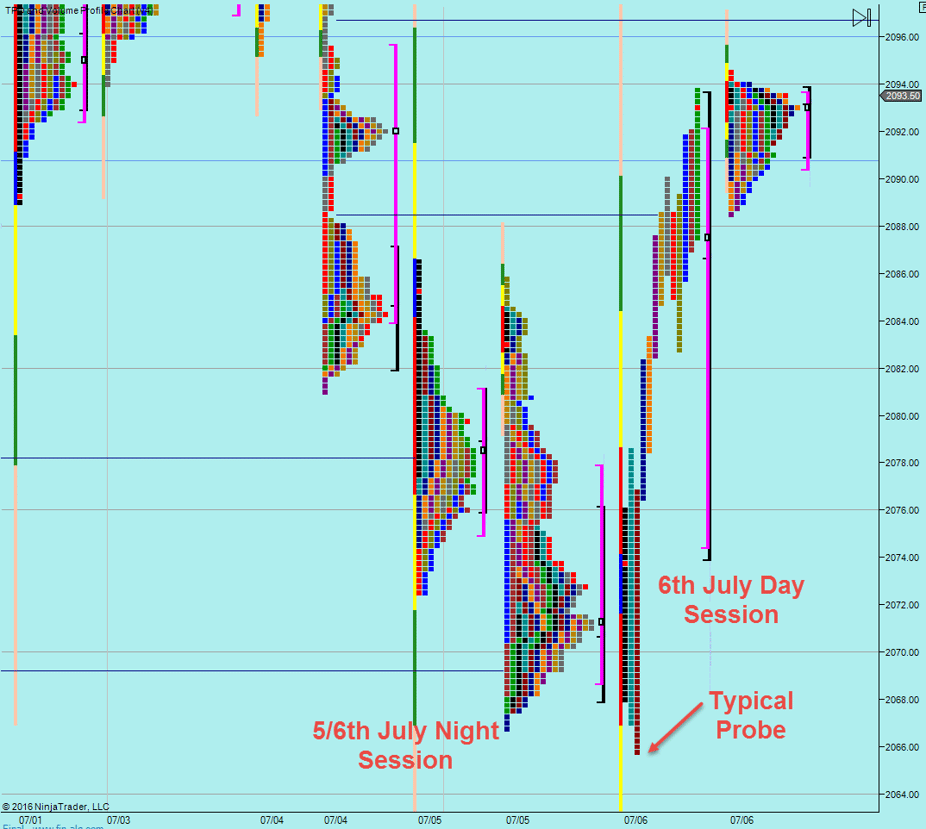
Yesterday we had a typical probe down through the overnight low. It’s normal for the S&P Futures to do that and typical of the sort of “wait for intraday action” to develop we get when there’s no clear commitment either way.
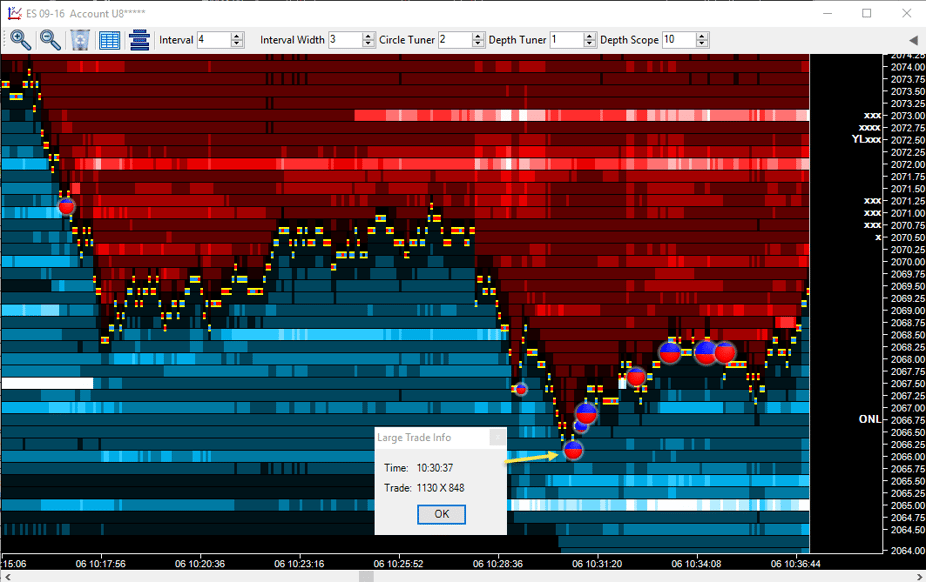
And here is the probe yesterday, We can see the large trade circle formed at the bottom of the range, showing that exceptional size traded at the low. 1130 Sell orders vs 848 buy orders. In effect sellers were trapped at that point. I tend to not enter at this point but wait for the market to move up a little to confirm that the sellers aren’t just trapped but actually exiting. That gives us a higher probability trade.
Plan
- We are watching for signs of clear commitment from speculators either side to break the range. Obviously there may be a test of a key level first (we are close to the highs after all) but it should be shown with a large swing in the market with exceptional volume.
- Pay attention at yesterdays high/low/value high/value low
- Until that happens – and it may not happen for a few days, we have to use yesterdays and developing intraday levels to play off and not have too high an expectancy of a large range.
- Be patient. There is no clear bias at this point.
Weekly Numbers
Range 2065.75 – 2104.75
Value 2076.75 – 2101.75
S1 – 2018.25, R1 – 2137.50
Daily Numbers
Range 2065.75 -> 2093.75
Value 2074.50 -> 2092
Globex 2088.50-> 2094.50
Settlement – 2094
Key Levels: 2096, 2090.75, 2012.75, 1957.50, 1910.75, 1824.50, 1795.50

