Over the next week, the main theme on US Index Futures and indeed, all other markets, is going to be analyzing overall market participation. There’s a number of reasons this should be the focus of our Analysis.
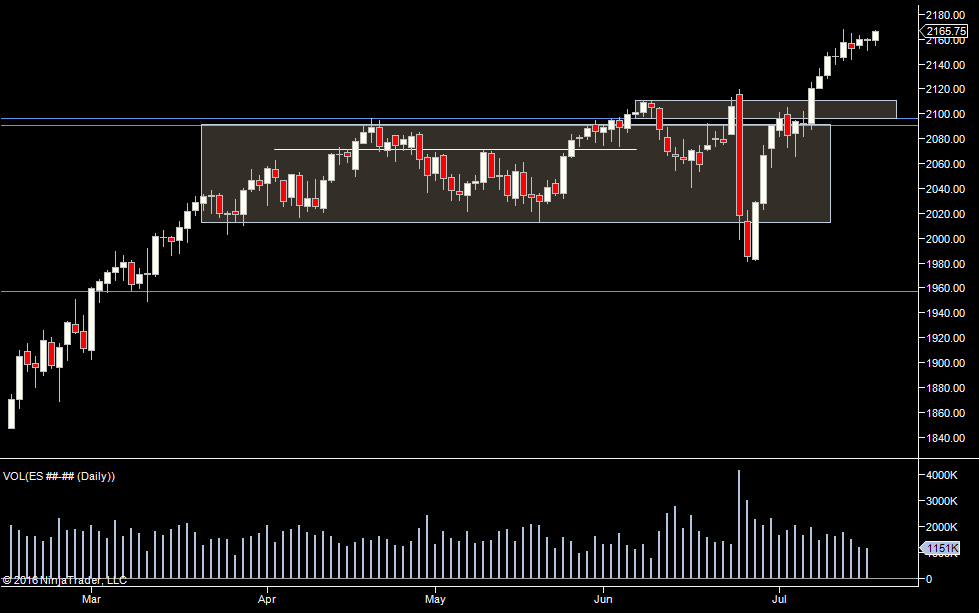
This is the daily chart of the eMini S&P500 Futures, as we can see, like all index futures markets, the volume has been declining. Yesterday we traded just 1.1 million contracts. Possible explanations for this are:
- Uncertainty on the behalf of short term speculators. After all, we have been in a range since mid-March and the market moved up 60 points in just a few days. Often, we see lack of participation because everyone else is waiting to see what everyone else is going to do.
- We are seeing the start of a Summertime Slowdown.
If it’s the former, we’ll shake this off and expand the range. We may start swinging between 2100 and 2200 for a while. If we do, we should still see decent participation and decent enough ranges. If it’s the latter, we will have to change approach to trading. For some that will mean becoming a range trader and some would be better off moving to a thinner market. For example a US index trader might move to Nasdaq Index Futures or Euro Currency Futures.
In some ways, consolidation after a move is a good thing. Value traders call it price acceptance – saying that people like these prices and want to trade here. Still, if people liked trading here, we’d expect to see a few more of them!
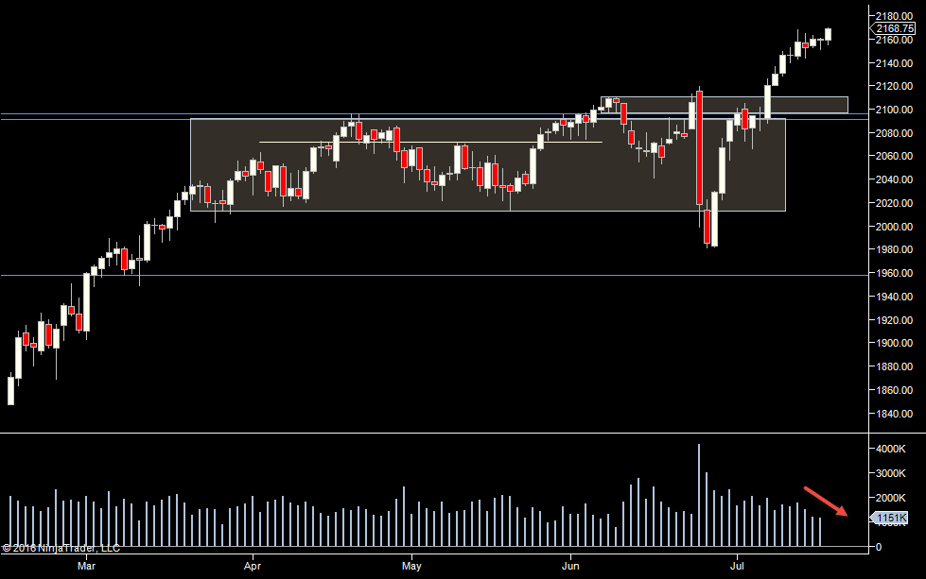
Volume ExpectationsSo right now, where is participation coming from? Well – we all know that the majority of trading on most days is short term speculators. HFTs are short term speculators. Then we know that some days we see a lot of institutional re positioning. The volume we see now indicates that it’s not large institutions trading this market.
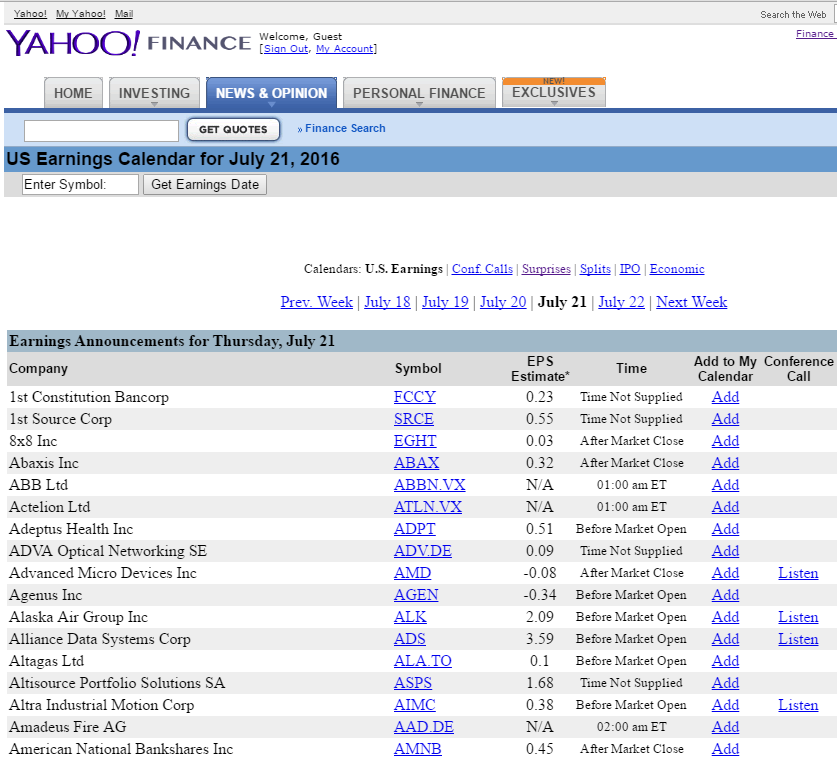
As usual, we have the usual suspects that could increase speculative volume. Scheduled economic news, unexpected news (good and bad), a technical breakout from the range and right now – earnings season. The earnings season occurs four times a year and is when US public companies publish their results. This kicks off mid-January, mid-April, mid-July and mid-October. There’s not much gap between earnings seasons but there’s a lot of insignificant companies reporting too. Alcoa is one of the first major companies to release earnings (11th July) and from that point we see more and more earnings out per day. The season then tapers off but does not have an official finish. So the bulk of major announcements started from 11th July. Right now, we have hundreds of companies reporting each day.
Earnings are announced before the open (impacting pre-market trade), after the close (impacting post-market trade) and then you have a few outliers than report in the middle of the night. No-one is allowed to report earnings during the trading day. There’s lots of sites with earnings calendars out there, like this one on Yahoo Finance:
There’s lots of stock day traders that play earnings announcements. So this does bring volume into the market. More importantly, on any day where a major company like Apple is announcing. If there is a surprise in the results, we can get a big boost in participation in the index futures. I guess it’s considered an economic event if a company like Apple significantly beats or fails to meet sales/earnings expectations.
When we look at the drop in volume right now, we have to consider we are in earnings season. It doesn’t seem to be helping much. At this time, don’t just keep an eye on scheduled economic announcements. Keep an eye on general financial news to see if any major company had a big hit or miss. Then you won’t be surprised if volume comes into the market as a result.
Index Futures Scenarios for the Coming Days
Above we have 2 market profiles. On the right is this week. We can see that this week we have most trade distributed from 2153 to 2161, then we have another smaller distribution above that. The scenarios I see playing out for the rest of the week.
- Yellow – we fall back to the top of the lower distribution (2161 area), that holds and gives speculators confidence to take it higher.
- Red – we move back through 2161, and just rotate (and maybe extend) around the weeks range.
We could of course lazily climb up but I would expect that to be lower participation as there’s been no test & hold.
Index Futures, Daily Profiles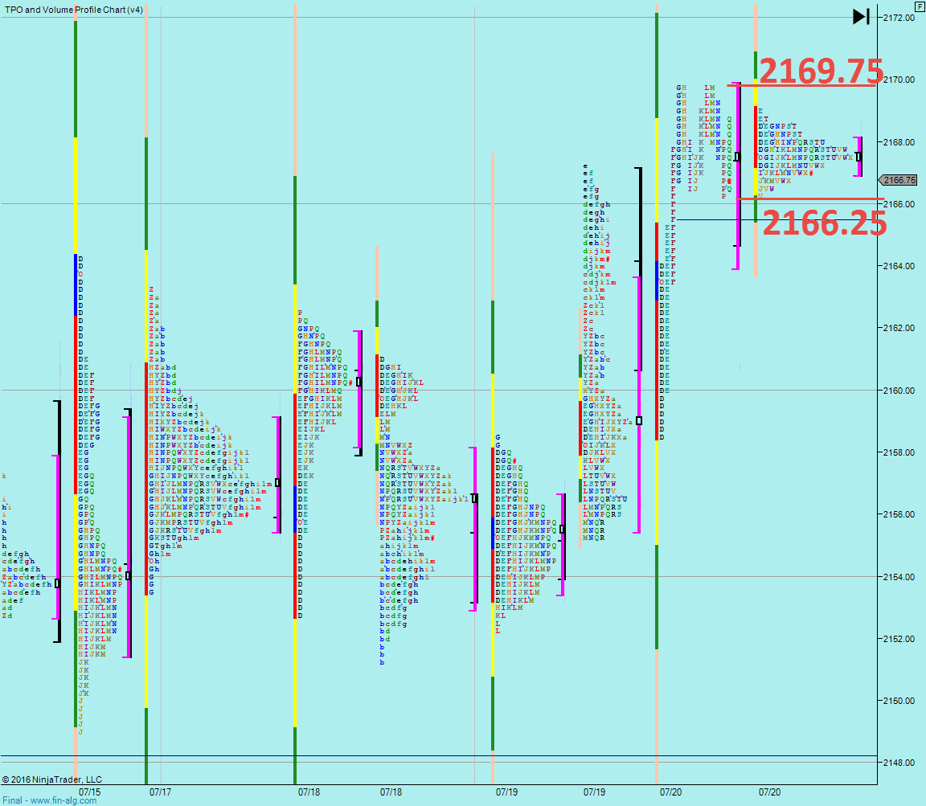
Yesterday, we can see a nice move up off the open and then consolidation from 2166.25-2169.75. As of writing, we are still trading in that area overnight (the small profile on the right). So our first “tell” will be whether that consolidation area holds or not. From a daily perspective, a pullback to 66.25 also seems like a decent place to see speculators jump in if it holds.
How was Yesterdays Volume?
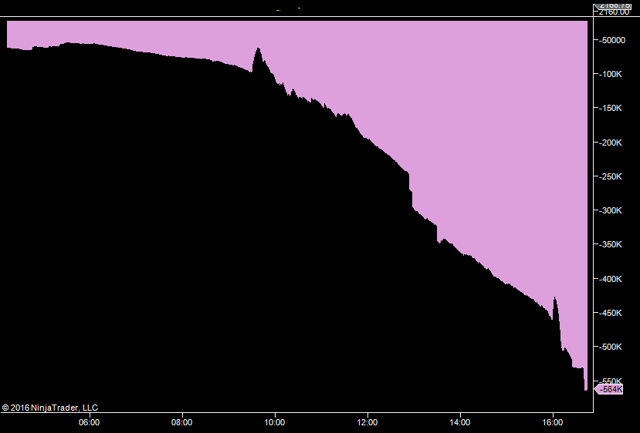
This chart shows how much volume we were trading at the time of day compared to the 60 day average. It was declining, which basically means less participation as the day progressed. We ended up half a million contracts below average.
How was Yesterdays Liquidity?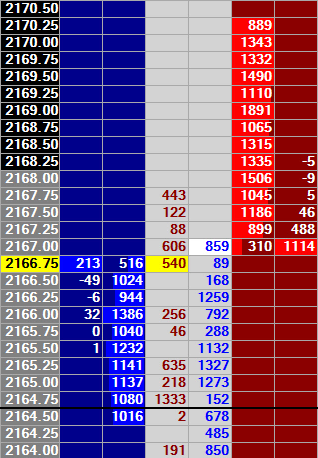
(Jigsaw Trading Depth & Sales)
Pretty thick for the S&P500 index futures nowadays. So we have more liquidity. More limit orders at each level and less volume (less market orders to eat that liquidity). This is why we are see the market so sluggish.
Yesterdays Swings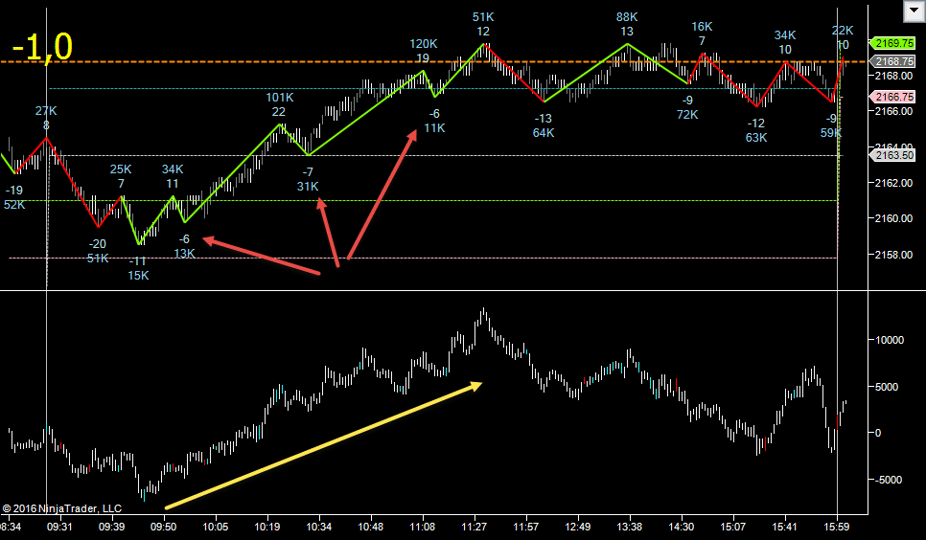
Yesterday we had a probe down and failed to get to the close (pink dotted line). We then had a few good upswings up with 6, then 7, then 6 tick pullbacks (red arrows). One of those pullbacks was back to the open (white dotted line). In retrospect it looks like we had some decent entry opportunities to the upside but with the low volume and overall low delta, I think that if you didn’t trade the upside, it was a decent decision. We got up to the overnight high (dotted blue line) and then moved sideways. Had we moved down, we’d have expected 6/7 tick pullbacks on the way down.
The good thing is that we can see we had players playing the “regular” levels that speculators play on the index futures. If we missed these levels yesterday because we presumed it would be a sloppy range, we can be alert for them today. The range is expanding to the upside, but I think it’s to early to say that we have left the range and aren’t going to see successively lower volumes over the coming weeks.
So all eyes on that.
So what’s the plan?- Look for a move back to 2161, look for good upside participation if it holds. Look for the market to continue the weeks range if it holds.
- Look also for a bounce at yesterday afternoon range 2166.25-2169.75
- Be aware that speculators seem to be playing intraday levels again so watch yesterdays high/low, value high/low and overnight high/low (numbers below)
- Watch for overall pace of the market and any early volume building that would indicate a range day
Weekly Numbers
Range 2151.25 –> 2169.75
Value 2153.75 -> 2161.25
S1 – 2130.75, R1 – 2169.75
Daily Numbers
Range 2155.25 /2158.50 -> 2169.75
Value 2164 -> 2169.75
Globex 2166.25 -> 2169
Settlement – 2167.50
Today only 2166.25, 2161
Key Levels: 2110.75 ,2096, 2090.75, 2012.75, 1957.50, 1910.75, 1824.50, 1795.50

