Upside speculation was quite evident in the Order Flow as we broke the highs earlier this week. We have stalled for the moment, so we need to think about what will bring in more speculators to the upside or conversely, what conditions will make people think the move is over.Still moving up, still biased long, still looking for a pullback to a local support level for a push up but also waiting for a more major pullback.

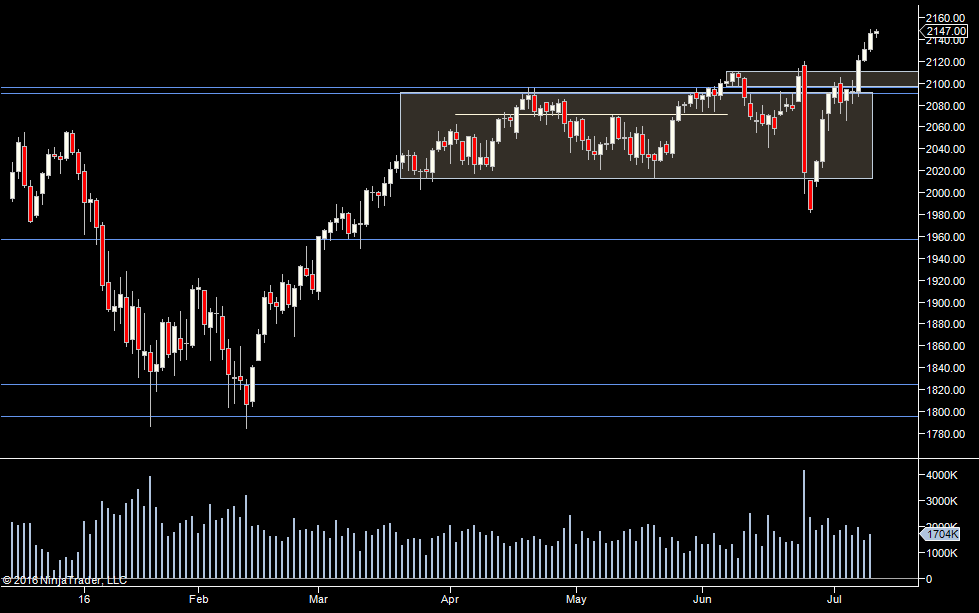
The larger white box shows the range we have been in since Mid March. As we discussed last time, it appears that now the Brexit news has been digested, we’ve finally managed to break out of that range. On a break like this it would be quite normal for us to drop back and test the high of the old range before progressing. The smaller upper white box with a high around 2110.75 looks like a good candidate for that fall back from a long term perspective.

This is the Market Profile for this week. We can see a large distribution built up this week from 2139 to 2149.25. As of writing – 3am EST, there has been a pop up to 2159.50 so far. So now the high of this large distribution is key. If we come back to 2149.25 in the US day session and it holds, we can expect upside order flow imbalance as speculators see the level hold and see opportunity to the upside. Conversely, if we start to trade through it, we can expect to continue to rotate around the 2139-2149.25 range.

Looking at Tuesday and Wednesday daily market profiles, we can see they both look non-directional. This was very different to Monday. We’ll take a look at why Monday was more attractive for speculative trade in a second. First, we can also see the large pop up overnight. We now need to build volume there – if you take a look at the volume traded for a second:

We can see that not much volume has traded (column 2) from 2146.24 to 2155. So if we dip below 2155, there is a good chance we’ll see 2146 fairly quickly. So careful if you are long there.
So the story so far. We have seen a pop through a medium term range, we’ve slowed down over the past 2 days but overnight we are seeing a new pop to the upside. That pop needs to consolidate and we need traders in the US session to support those prices.
A look at Monday’s Order Flow Participation

On Monday we were looking for a test and at point “A” above, we can see we came down and tested the green line, which was the prior days high. This is a level that a lot of day traders look at. You can see that when the level held, many traders jumped in long and by point B, we had traded 168,000 contracts and moved 9 points. In the frame below, we can see a large shift to the upside in the Cumulative Delta (it measures buy market orders minus sell market orders). So we had already broken the high, we came down to an area lots of traders watch and then we saw massive order flow to the upside after it held. This is EXACTLY what we’ll be looking for over the coming days to take continuation trades to the upside. In fact, remember that most days we swing up and down, so it’s what we want to see to the downside too – just that now my bias is long.
Why was Wednesday Order Flow so Different?

If we look at yesterday, we did not see the same sort of excitement after hitting the low of the day. The early part of the day was indecisive. Basically, we were just trading within yesterdays range. The market chopped around. When we hit the lows, we were just short of the 2139 level in the large distribution from the weekly profile above. So we were basically probing the bottom of a trading range and that’s simply not as exciting. Now- had we popped the top of that trading range, no doubt we’d have seen significant order flow to the upside after the pop. This is counter to most traders instincts – to actually buy a market AFTER a move up. In this case, we did have a trade location at the bottom of the range. But we had to wait a long time for it and it would have been a hard trade to hold onto because of all the counter moves.
Wednesday Order Flow History at the Low

Also from yesterday here’s the Auction Vista chart showing a summary of the Order Flow. We can see at Point A as we came down to the bottom of the 2 day range that the bids (the blue area below the yellow lines) were much thicker (because of the lighter color). We got to the bottom of the range, we see no large trade circle because not much traded down there. We simply ran out of sellers. Nobody wanted to sell the bottom of the range, which is another reason the reaction to the upside was muted. No-one was really trapped at the bottom.
At point B above, we can see something else that is common on days where speculative order flow isn’t one sided – that is seeing areas where massive volume of trade occurs. In the large circle, we can see that 5823 sell market orders hit the market and it didn’t tick down. So we see two potential places to enter the market here. Point A, from a price action perspective we are at the bottom of a trading range and we saw sell side order flow inactive there as well as thicker offers. At point B, we see massive selling with no resulting move down. We already have a short term long bias because the bottom of the range held and now we have order flow telling us that selling just isn’t working. There is a large iceberg order absorbing it.
So a trade at the bottom of a trading range sees upside order flow – but not as strong as a pullback to the high of the prior day when we aren’t in a trading range. That basically is the crux of trading, understanding where people may get in and also understanding that the clearer the picture for everyone, the more one sided the order flow will be.
So today’s plan (and for the following days)
- Biased to the upside
- Only take short trades if significant selling (imbalanced order flow/high volume) is evident – we still may need to test 2109 before we can get to 2200
- Look for a test at the top of the 2 day range (2149.25) and for significant participation upside if we get that
- If there is no test, look below for an area of high volume in the profile to play off, don’t expect the same sort of reaction
- If we keep these highs into the stock market open, it means the S&P futures have moved way ahead of the stock market and that ‘balance’ needs to be addressed at the open. This could mean an initial move down or just generally whippy action – so it may be better to sit out the first 15 minutes of trade.
- Be wary of a rapid drop if we trade below 2155.
Weekly Numbers
Range 2120 – 21.75
Value 2130.25- 2151.75
S1 – 2018.25, R1 – 2137.50
Daily Numbers
Range 2139.50 -> 2150.75 / 2152.25
Value 2143.25 -> 2147.75
Globex 2142.75-> 2161.50
Settlement – 2146
Today only – 2149, 2139
Key Levels: 2110.75 ,2096, 2090.75, 2012.75, 1957.50, 1910.75, 1824.50, 1795.50

