Note - new levels below - the Sept contract is about 9.25 points below June.

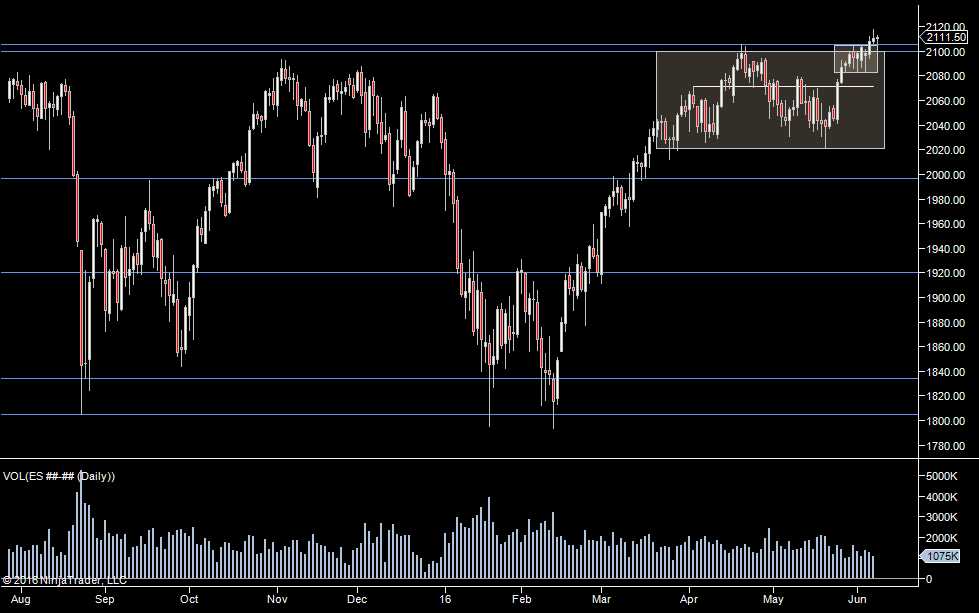
Much more volume on Friday AND A down day. So today looking for signs we are done to the upside and now heading down to the bottom of the range (larger white box) to 2011.50.
If we do move down, we should pay attention the last time we pushed down (2 week low) to 2073.75. Past that, all clear from the perspective of the longer term charts.

VIX is moving up too, so be on the look out for increase volatility compared to last Wednesday (before the rollover).

To the upside, we have a lower distribution above us at 86. So watch that area if we do move up.

Relatively speaking, Friday was a decent down day if you include overnight. So we have to look for a snap back up from the open. That may or may not follow through it if does happen, so watch out Fridays value/extremes if we move up.
Plan
- look for a snap up off the open with caution that it may just be a temporary reaction
- if not (or if the snap up fails), watch for a down move with volume for a continuation from Friday
- expect higher volatility/lower liquidity - but be ready to adjust if it reverts to rangebound
In effect, looking for decent volatility with volume to follow.
Weekly Numbers
Range 2079.50 -> 2110.75
Value - 2094.25 -> 2109.25
S1 - 2074.25 R1 - 2105.50
Daily Numbers
Range 2079.50 / 2094 -> 2105.25
Value 2085.50 -> 2093.50
Globex 2077 -> 2084.75
Settlement - 2087.25
Today only 2086
Long Term 2096, 2090.75, 1957.50, 1910.75, 1824.50, 1795.50

