
After experiencing losses last year, almost every asset class is moving higher through the first quarter 2019. Stocks are rallying. Bonds are bid. The dollar is up. But the biggest gains have been in the energy sector, including a sharp rebound in the price of Crude Oil.
Energy
(all numbers updated through March 22 midday)
|
2018 |
Q1 2019 |
|
|
Crude Oil |
-23.02% |
25.89% |
|
Natural Gas |
-9.49% |
3.75% |
|
Gasoline |
-15.83% |
26.40% |
Crude Oil has rallied 25% year to date. Gasoline is up a bit more than that. Natural Gas has recovered 3.75% of a 9.5% loss in 2018. Yet even after the broader gains across the energy sector, Crude Oil is still well below the highs seen in early October (as we can see from Figure 1).
Specifically, it has recovered $15 of the $31.50 drop suffered from October 3, 2018, to December 24, 2018. It would need to rally another $16 to recoup the entire loss. Nevertheless, on a percentage basis, Crude Oil is doing better than the rest.
 Figure 1: CL May Daily Chart
Meanwhile, in Stocks…
Stocks, meanwhile, have mostly recovered the losses suffered from early October to late December. The Dow is lagging, due largely to big losses in Boeing (BA) shares. But most stock indexes, including the Russell 2000 Small Cap Index and the S&P 500, have erased 2018 declines and a lot more.
Stocks
|
2018 |
Q1 2019 |
|
|
S&P 500 |
-6.25% |
12.62% |
|
Dow Jones Industrials |
-5.87% |
10.71% |
|
NASDAQ 100 |
-0.82% |
17.70% |
|
Russell 2000 |
-12.15% |
14.35% |
The biggest winner: a 17.7% advance in the tech-heavy NASDAQ 100. At 2400, June NQ Futures (Figure 2) are now up 4% in March after a successful re-test of the 7000 level on March 8th.
 Figure 2: NASDAQ 100 (NQ) June Futures
Metals
|
2018 |
Q1 2019 |
|
|
Gold |
-1.60% |
1.94% |
|
Silver |
-8.86% |
-1.54% |
|
Copper |
-19.51% |
7.95% |
In the metals market, Gold and Silver are seeing mixed action. Copper has been a bright spot; after shedding nearly 20% last year, the metal is up 8% year to date. However, Figure 3 shows notable weakness in Copper prices in late March and May futures falling back toward a 50-day moving average as well as a previous support/resistance level at $2.84.
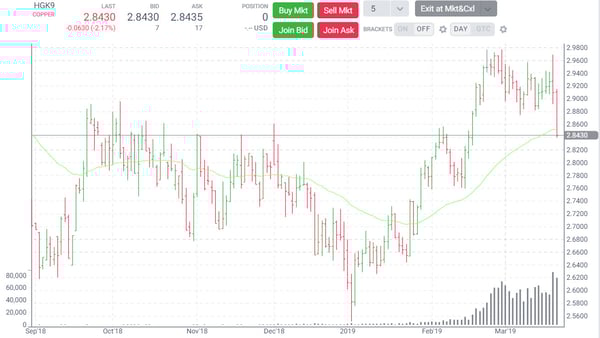
Figure 3: Copper (HG) May Futures
Currencies
|
2018 |
Q1 2019 |
|
|
Bitcoin |
-72.08% |
7.53% |
|
US Dollar Index |
3.70% |
0.97% |
|
EUR/USD |
-4.53% |
-1.40% |
|
USD/JPY |
-3.69% |
1.59% |
The Dollar index is building on an advance in 2018 and is higher against other majors, including the Euro and Yen. For example, the uptrend in Dollar-Yen (USD/JPY) since the “flash crash” in late 2018 remained intact until March 20. Then a steep drop violated trendline support (Figure 4). USD/JPY seems to be searching for stability around the 110 area.

Figure 4: USD/JPY Daily Chart
Treasury Bonds
|
2018 |
Q1 2019 |
|
|
2-Year |
-0.81% |
0.29% |
|
5-Year |
-1.27% |
1.00% |
|
10-Year |
-1.52% |
1.60% |
|
30-Year |
-5.07% |
2.50% |
Lastly, Treasury bond yields are at 14-month lows. The decline in yields, which move opposite to Treasury bond prices, is part of a trend that started in early October and has gathered some momentum lately. After lagging last year, the longest-dated T-Bond is leading the rebound effort. The advance gathered some momentum in late March (as we can see from Figure 5), when prices broke out from a range and jumped to 2019 highs.
 Figure 5: Treasury Long Bond June Futures
